Spending
The Spending tab shows you where your money is going, by category, so you can better understand your spending habits and stay on track.
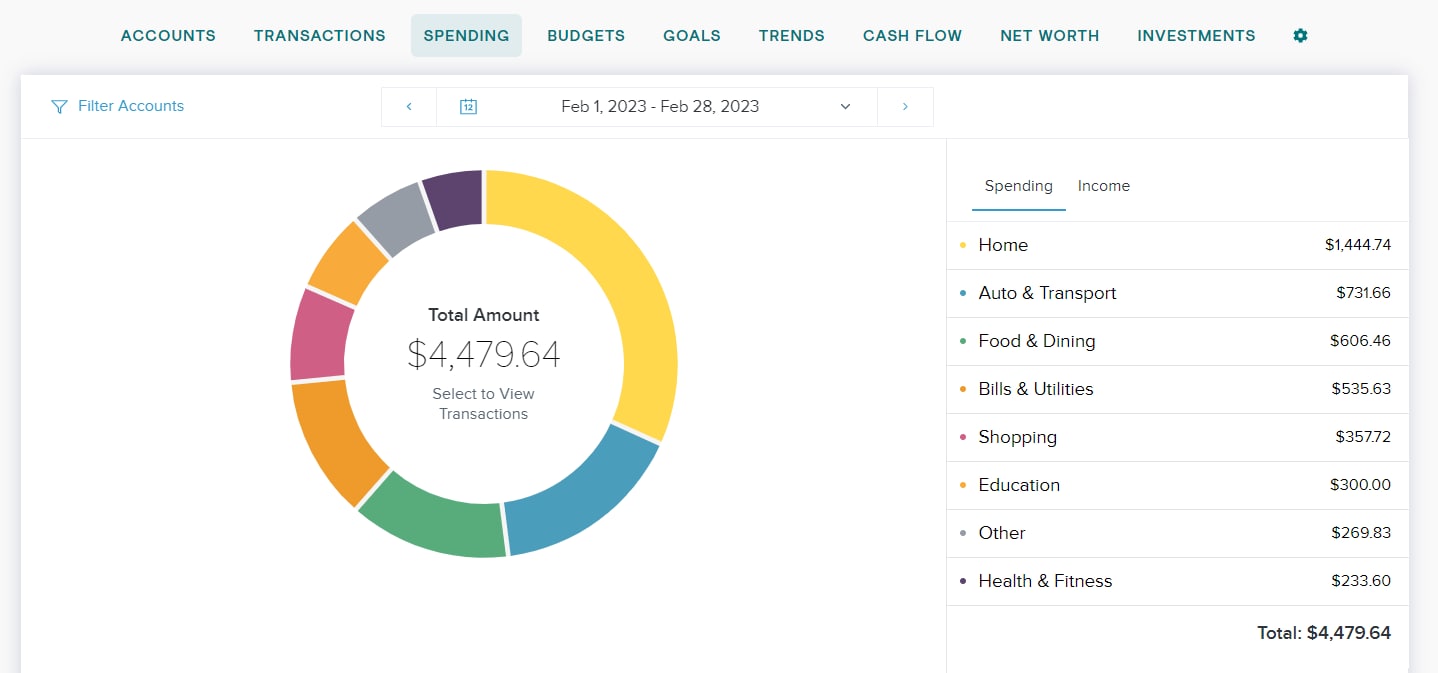
The totals of each category will show on the side of the screen, but you can also click on any section of the chart to see how much you spent in each category.
- If your spending in a category is below 3% of your overall spending, it will be grouped in “Other” with other low-spending categories.
Double click on any category to see a breakdown of spending by subcategory, such as how much of your spending in Food & Dining is on groceries versus eating out.
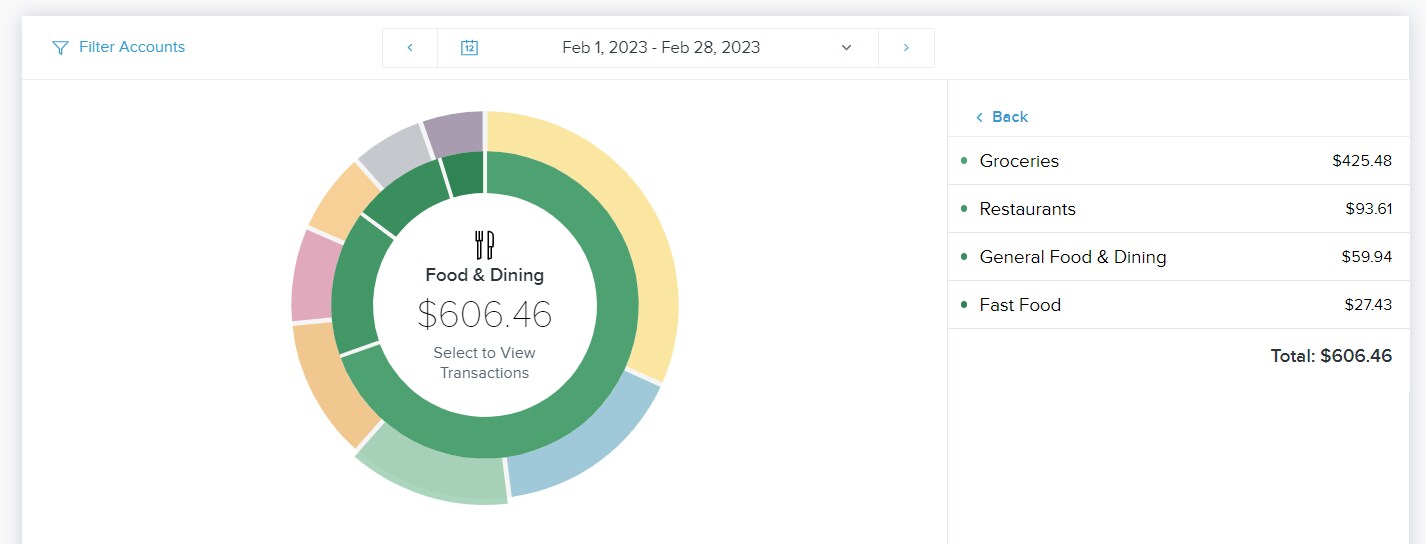
Click on any subcategory, or on the center of the spending wheel, to see the transactions associated with the selected subcategory.
To return to the main spending wheel, click on the blue arrow in the corner, or in the gray area outside of the Transactions view.
Customize Accounts and Dates
You can choose which accounts will be included in the spending chart by clicking 'Filter Accounts' dropdown on the top left corner of this tab.
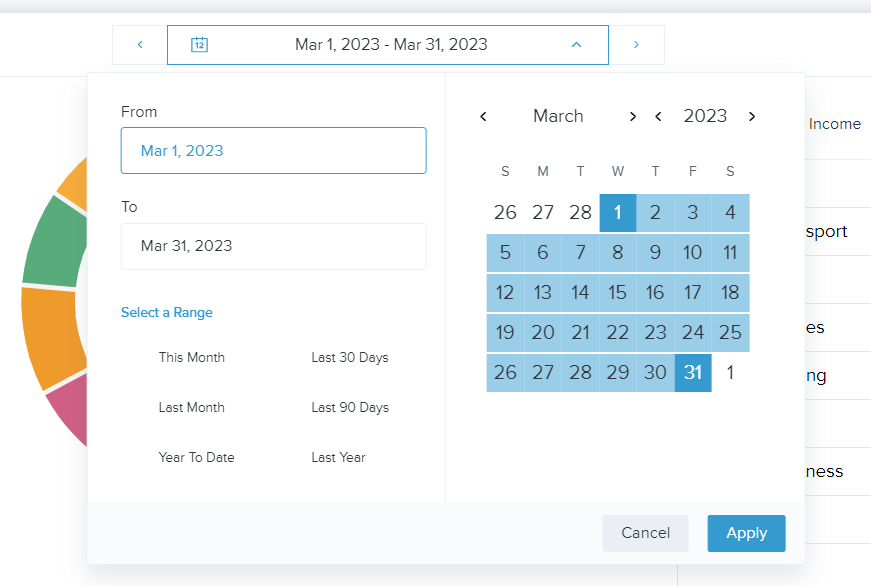
You can also adjust the date range at the top of the tab. There are several options for adjusting the date:
- Use the back and forward arrows to navigate through time
- Use the dropdown arrow to select from a list of preset date range options.
- Use the dropdown arrow to open the calendar view to select a custom date range.
Click ‘Apply’ to confirm any changes to the date range.
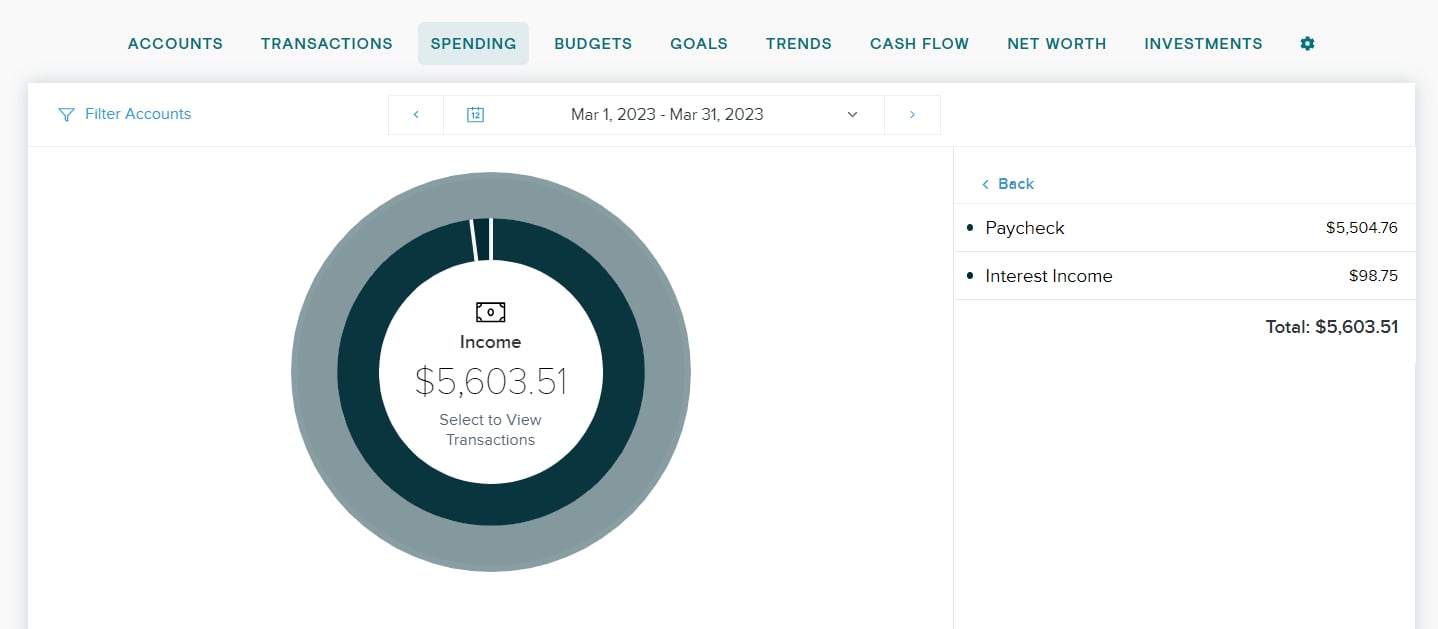
Income Report
To view your income, click on “Income” on the top right.
As with the spending section, you can click on an income category to view your income by subcategory and see the transactions included.